XahLee.org Web Traffic Report 2006
This page gives a glimpse of web traffic on Xahlee.org in 2006-10.
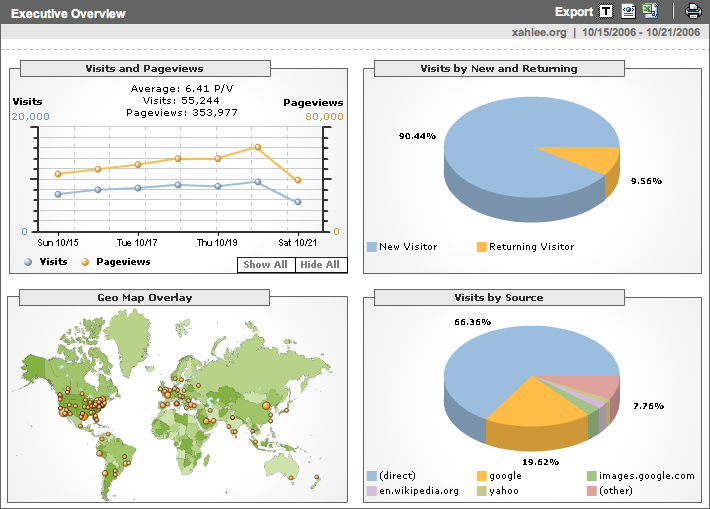
In general, there are about 7.5 k visits daily, with 20 k page views daily. The monthly bandwidth is about 110GB.
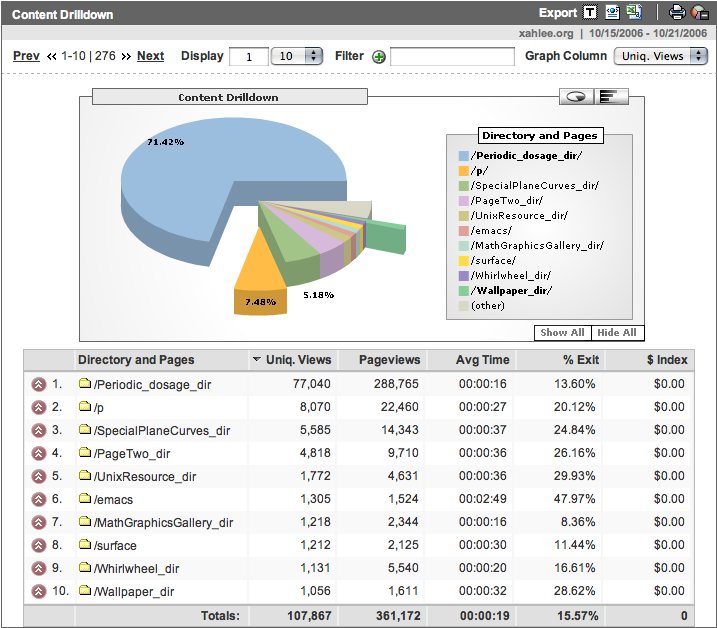
Here are the typical top files accessed. (excluding uninteresting files such as style sheets, favicon, robot.txt etc.)
| Top 30 of 18180 Total URLs | |||||
|---|---|---|---|---|---|
| # | Hits | KBytes | URL | ||
| 3 | 41606 | 0.83% | 331438 | 0.28% | /Periodic_dosage_dir/t1/20040203_lunbe_zekri.html |
| 6 | 16192 | 0.32% | 89258 | 0.07% | /Periodic_dosage_dir/lanci/merko_misno.html |
| 8 | 10390 | 0.21% | 57122 | 0.05% | /Periodic_dosage_dir/lanci/index4.html |
| 9 | 9930 | 0.20% | 90696 | 0.08% | /Periodic_dosage_dir/20030926_gubernatorial.html |
| 11 | 9140 | 0.18% | 35054 | 0.03% | /Periodic_dosage_dir/lacru/rama.html |
| 12 | 8361 | 0.17% | 36390 | 0.03% | /Periodic_dosage_dir/t1/female_wants.html |
| 13 | 7361 | 0.15% | 642 | 0.00% | /Periodic_dosage_dir/lanci/ |
| 15 | 6845 | 0.14% | 64195 | 0.05% | /PageTwo_dir/more.html |
| 18 | 6511 | 0.13% | 49240 | 0.04% | /Periodic_dosage_dir/lanci/lanci.html |
| 19 | 6317 | 0.13% | 15819 | 0.01% | /Periodic_dosage_dir/lanci/supermodels.html |
| 21 | 5929 | 0.12% | 73770 | 0.06% | /Periodic_dosage_dir/t1/cmaci_larcu2.html |
| 22 | 5925 | 0.12% | 20292 | 0.02% | /Periodic_dosage_dir/lacru/rama2.html |
| 23 | 5789 | 0.12% | 12518 | 0.01% | /Periodic_dosage_dir/lanci/t9.html |
| 24 | 5690 | 0.11% | 22631 | 0.02% | /Periodic_dosage_dir/lanci/ss/t2/acd882_450.jpeg |
| 25 | 5557 | 0.11% | 22680 | 0.02% | /Periodic_dosage_dir/lanci/traji_tsali_nanmu.html |
| 26 | 5514 | 0.11% | 12927 | 0.01% | /Periodic_dosage_dir/lanci/merko_jmive.html |
| 27 | 5066 | 0.10% | 12721 | 0.01% | /Periodic_dosage_dir/lacru/Gilles_Tran.html |
| 28 | 5053 | 0.10% | 14005 | 0.01% | /p/alice/alice_art.html |
| 29 | 4911 | 0.10% | 15702 | 0.01% | /Periodic_dosage_dir/lacru/rama3.html |
Here are the top urls by file size.
| Top 10 of 18180 Total URLs By KBytes | |||||
|---|---|---|---|---|---|
| # | Hits | KBytes | URL | ||
| 1 | 693 | 0.01% | 816231 | 0.68% | /Periodic_dosage_dir/lanci/_p/Jimi_Hendrix-Star_Spangled_Banner.mp3 |
| 2 | 87 | 0.00% | 398467 | 0.33% | /p/alice/i/am/alice_hi_m.mov |
| 3 | 107 | 0.00% | 349266 | 0.29% | /SpecialPlaneCurves_dir/MmaPackages_dir/ParaPlot_dir.zip |
| 4 | 41606 | 0.83% | 331438 | 0.28% | /Periodic_dosage_dir/t1/20040203_lunbe_zekri.html |
| 5 | 2082 | 0.04% | 323395 | 0.27% | /p/alice/i/ar/plate4.jpeg |
| 6 | 394 | 0.01% | 230863 | 0.19% | /Periodic_dosage_dir/lanci/_p/Marvin_Gaye_usa_anthem.mp3 |
| 7 | 1796 | 0.04% | 188609 | 0.16% | /p/alice/i/ar/frontispiece.jpeg |
| 8 | 177 | 0.00% | 151355 | 0.13% | /Periodic_dosage_dir/_p/i-doloid.pdf |
| 9 | 228 | 0.00% | 145036 | 0.12% | /surface/javaview.jar |
| 10 | 4809 | 0.10% | 117566 | 0.10% | /UnixResource_dir/freebooks.html |
See Detailed webalizer report webalizer_2006.zip for late May to early October.